Intro
This article attempts to analyse a particular detection mechanism of a particular EDR through debugging and reverse engineering. My primary aim was not to understand in detail every line of disassembled code in the reverse engineering process. Rather, I was interested in developing a solid understanding of how the newly implemented detection mechanism in the EDR works, exploring the functions of this mechanism, questioning the reasons for its possible implementation, and thinking about possible evasions from an attacker's (red team) perspective.
Furthermore, I think it is important to understand that any commercial EDR is ultimately a black box. You can try to learn more about how the EDR works through various methods such as static and dynamic analysis, but the inner workings and logic in particular remain largely a black box. Hypotheses can be formulated about the inner workings and logical construction of EDRs, which can then be analysed to validate these hypotheses. However, it is often difficult to achieve complete clarity and unambiguous statements about their functionality.
The starting point for my analysis of the previously unknown detection behaviour in the context of the EDR under investigation is the hypothesis that the EDR uses a new, additional DLL in addition to the known hooking DLL, which is used in the context of specific APIs to identify malware through the telemetry obtained by thread call stack analysis. In this article I will try to explain and substantiate this hypothesis.
I thought I knew your DLLs
As mentioned in the introduction, I had already looked at the EDR in question on a number of occasions. I already knew that the EDR used user mode hooking via inline hooks, and I also knew the name of the user mode hooking DLL. However, using the tool System Informer (or Process Explorer or Process Hacker), I found that the EDR had recently started using another DLL in addition to the user mode hooking DLL. In the following picture, I simply started a notepad.exe and used System Informer to examine the DLLs loaded into the process memory. Since I want to protect the vendor and not reveal the name of the DLL, we will simply call this DLL the new DLL in this article.
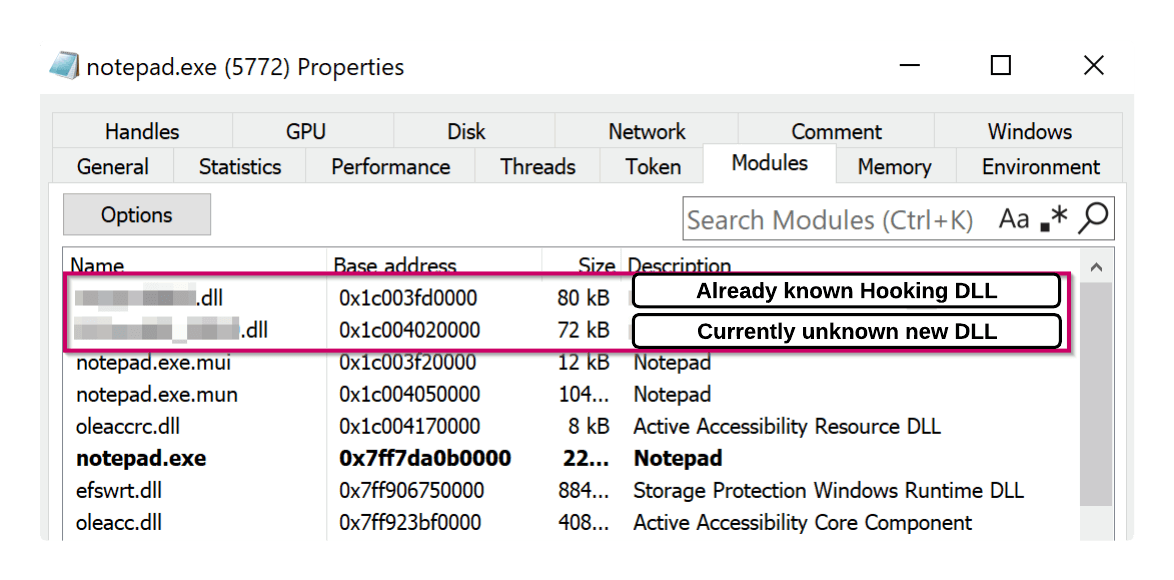
This first observation serves as a starting point for further analysis of the EDR. To find out more about its scope and functionality, we will try to analyse the EDR and the new DLL in more detail. On the one hand we want to examine the new DLL statically with IDA and on the other hand we want to find out more about the dynamic behaviour of the new DLL by debugging with x64dbg.
Hooks, hooks and more hooks
Fortunately, a few months ago, in connection with the EDR to be analysed, I created a list documenting which APIs were hooked by the user mode hooking DLL at that time. For example, typical APIs such as VirtualAlloc or NtAllocateVirtualMemory were last provided with an inline hook. In general, the number of hooks in the context of the EDR being analysed varies depending on the configuration.
When I created the API Hooking List about 6 months ago, I knew that the EDR in its most comprehensive configuration had about 60 inline hooks implemented in various DLLs, including ntdll.dll, kernel32.dll and kernelbase.dll. To bring the API hook list up to date, I have created an updated list. For example, the tool HookDump can be used to automatically generate the API Hooking List.
Comparing the new data with my previous records shows that EDR has added more APIs with inline hooks since my last investigation, such as CreateThreadPoolWork, CreateThreadPoolWait, OpenProcess and WriteProcessMemory. Overall, the EDR now appears to provide a much larger number of APIs with inline hooks than was the case in my previous analysis. It is important to note that the intensity with which the new DLL is used is variable in the EDR configuration. This has a direct impact on the total number of user mode inline hooks.
The total number of user mode inline hooks is made up of the number of hooks implemented in the context of the already known hooking DLL and the number of hooks added by the previously unknown new DLL. Depending on the configuration of these two DLLs within the specific configuration settings, the total number of user mode inline hooks can vary considerably, reaching values of over 150 user mode inline hooks distributed across different DLLs. Compared to other EDR systems that I know of that use user mode hooking, this maximum number of inline hooks seems exceptionally high.
To further validate the results of HookDump, I used x64dbg to randomly examine the APIs that had new inline hooks since my last analysis. Among other things, I looked at the CreateThreadPoolWork and CreateThreadPoolWait APIs. To do this, I simply started a Notepad process and used the debugger to analyse the DLLs loaded into memory for inline hooks. The following figure confirms the result of HookDump: The two APIs CreateThreadPoolWork and CreateThreadPoolWait in the kernel32.dll loaded by notepad.exe are indeed provided with inline hooks. The hook can be identified by the unconditional jmp instruction or the associated opcode E9.
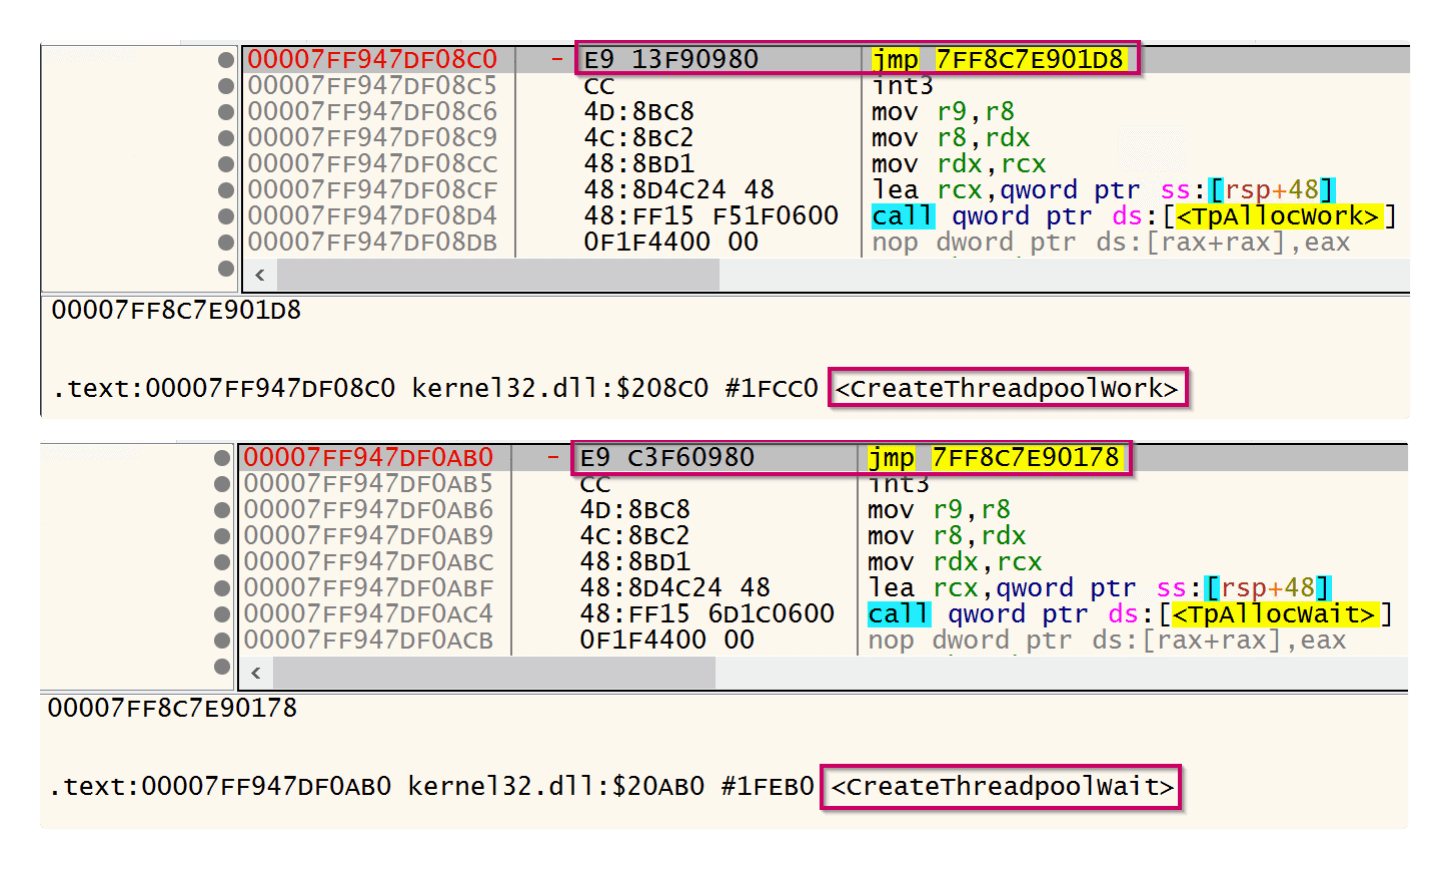
So far it can be said that EDR uses an additional new DLL in addition to the already known hooking DLL. This new DLL adds inline hooks to other APIs such as CreateThreadPoolWork, CreateThreadPoolWait, OpenProcess, WriteProcessMemory etc., which probably causes the code to be redirected into the memory area of the new DLL (more on this later). However, to gain a deeper understanding of the behaviour and function of the new DLL, we need to dig a little deeper.
EDR DLL - Static Analysis
A relatively simple approach to the investigation, which should provide some support for the hypothesis. During the static analysis of the new DLL with IDA, it can be observed that functions are imported or references to functions are present that are commonly used in the context of x64 exception handling and call stack analysis on Windows. For example, the Windows APIs RtlAddVectoredExceptionHandler and RtlRemoveVectoredExceptionHandler are imported from ntdll.dll, which are required to register and deregister a Vectored Exception Handler (VEH).

In addition, the new DLL contains references to the memory addresses of the RtlCaptureContext, RtlLookupFunctionEntry, RtVirtualUnwind, RtlUnhandledExceptionFilter and NtTerminateProcess functions within ntdll.dll (more on this later).

Vectored Exception Handler Function
As part of the static analysis of the new DLL of the EDR, I attempted to gain a more detailed insight into the structure of the Vectored Exception Handler (VEH) function of the EDR, and to understand which specific exceptions activate the VEH. The pseudocode analysed shows that the ExceptionRecord is structured in such a way that the hexadecimal value 0x40000000 is added to the ExceptionCode. This is then compared to the value 0x4EFFF using a less or equal operation. This specific operation and the associated values are not entirely clear to me at first, but an ExceptionCode that is within the defined range after this addition and comparison operation will result in the sub_180001E10 function being called. Since this is pseudocode, it is also possible that the ExceptionCode is simply misinterpreted. We will see what type of exception the EDR uses in its VEH function a little later in the dynamic analysis section.
__int64 __fastcall VectoredHandler(struct _EXCEPTION_POINTERS *ExceptionInfo)
{
  __int64 v2; // rax
  __int64 v3; // rbx
  __int64 v4; // rcx
  __int32 ExceptionCode; // edx

  if ( ExceptionInfo->ExceptionRecord->ExceptionCode + 0x40000000 <= 0x4EFFF )
  {
    v2 = sub_180001E10();
    v3 = v2;
    if ( v2 )
    {
      if ( *(_DWORD *)(v2 + 20) && *(_BYTE *)(*(_QWORD *)(v2 + 24) + 49i64) )
      {
        **(_QWORD **)(v2 + 8) = *(_QWORD *)v2;
        v4 = *(_QWORD *)(v2 + 24);
        ExceptionCode = ExceptionInfo->ExceptionRecord->ExceptionCode;
        _InterlockedIncrement64((volatile signed __int64 *)(v4 + 144));
        if ( (**(_BYTE **)(v4 + 24) & 8) == 0 )
        {
          _InterlockedExchange((volatile __int32 *)(v4 + 168), ExceptionCode);
          sub_180003E60(v4, v2);
        }
        _InterlockedExchange((volatile __int32 *)(v3 + 20), 0);
      }
    }
  }
  return 0i64;
}
EDR DLL - Dynamic or Behavioral Analysis
To better understand the dynamic behaviour of the new DLL in the context of malware, the following C code is used. This POC demonstrates the execution of shellcode using the CreateThreadPoolWork callback function, which, as noted, is inlined by the EDR under investigation to cause a redirection to the new DLL.
Executing shellcode via callbacks and thread pools offers some interesting possibilities from an attacker's point of view, which I think is one of the reasons why the EDR with the new DLL also provides these APIs with an inline hook. I won't go into the functionality of callback functions and thread pools here. However, if you want to learn more about thread pools, I recommend the following blog post A Deep Dive Into Exploiting Windows Thread Pools by Diago Lima or the blog post The Pool Party You Will Never Forget by Alon Leviev.
// Based on CreateThreaPoolWait POC from Alternative Shellcode Execution via Callbacks Repo
// https://github.com/aahmad097/AlternativeShellcodeExec

#include <windows.h>
#include <stdio.h>
#include <threadpoolapiset.h>

// Define the shellcode to be executed. In practice, this would be malicious code.
unsigned char shellcode[] = "\xfc\x48\x83...";

int main() {

    // Prompt the user to press any key to start the process. This is a simple synchronization point for demonstration.
    printf("[+] Press Key to start debugging \n");
    getchar(); // Wait for user input to proceed.

    // Allocate a block of memory with read-write permissions to store the shellcode.
    LPVOID addr = VirtualAlloc(NULL, sizeof(shellcode), MEM_COMMIT, PAGE_READWRITE);

    // Copy the shellcode into the newly allocated memory space.
    // This is necessary because executing code directly from static data sections is typically not allowed.
    RtlMoveMemory(addr, shellcode, sizeof(shellcode));

    // Change the memory protection to execute-read to allow the CPU to execute the shellcode.
    DWORD oldProtection;
    if (!VirtualProtect(addr, sizeof(shellcode), PAGE_EXECUTE_READ, &oldProtection)) {
        printf("%d", GetLastError()); // If changing protection fails, print the error code.
    }

    // Create a thread pool work item that points to the shellcode's memory address.
    // This effectively schedules the shellcode for execution in a separate thread managed by the OS.
    PTP_WORK ptp_work = CreateThreadpoolWork((PTP_WORK_CALLBACK)addr, NULL, NULL);

    // Submit the work item to the thread pool. This action queues the shellcode for execution.
    SubmitThreadpoolWork(ptp_work);

    // Wait for the thread pool work item to complete execution.
    // The FALSE parameter indicates we do not cancel pending callbacks if they're not started.
    WaitForThreadpoolWorkCallbacks(ptp_work, FALSE);

    // This loop serves a critical purpose in the context of this program, where shellcode is executed asynchronously
    // in a separate thread managed by the Windows thread pool. The execution of shellcode is scheduled via
    // SubmitThreadpoolWork(), and this operation is non-blocking; meaning, it allows the main thread to continue
    // running immediately after the call. Without a mechanism to keep the main thread running, the program would
    // terminate, and as a result, the Windows process that hosts this program (and all its threads, including the
    // thread pool ones) would be destroyed before the shellcode has a chance to execute or complete its execution.
    while (TRUE) {
        Sleep(3000);
    }
}
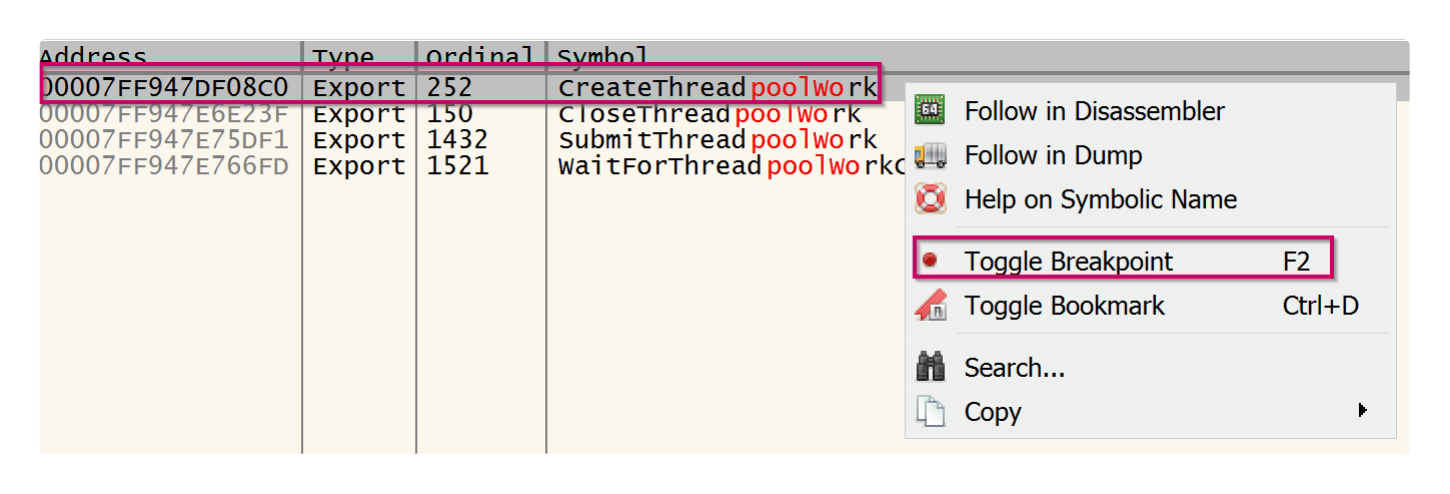
To begin our investigation into the dynamic detection behaviour of EDR in relation to the CreateThreadPoolWork callback function, we first set a breakpoint to the base address of the CreateThreadPoolWork API. Our goal is to validate that we actually reach the API during program execution.
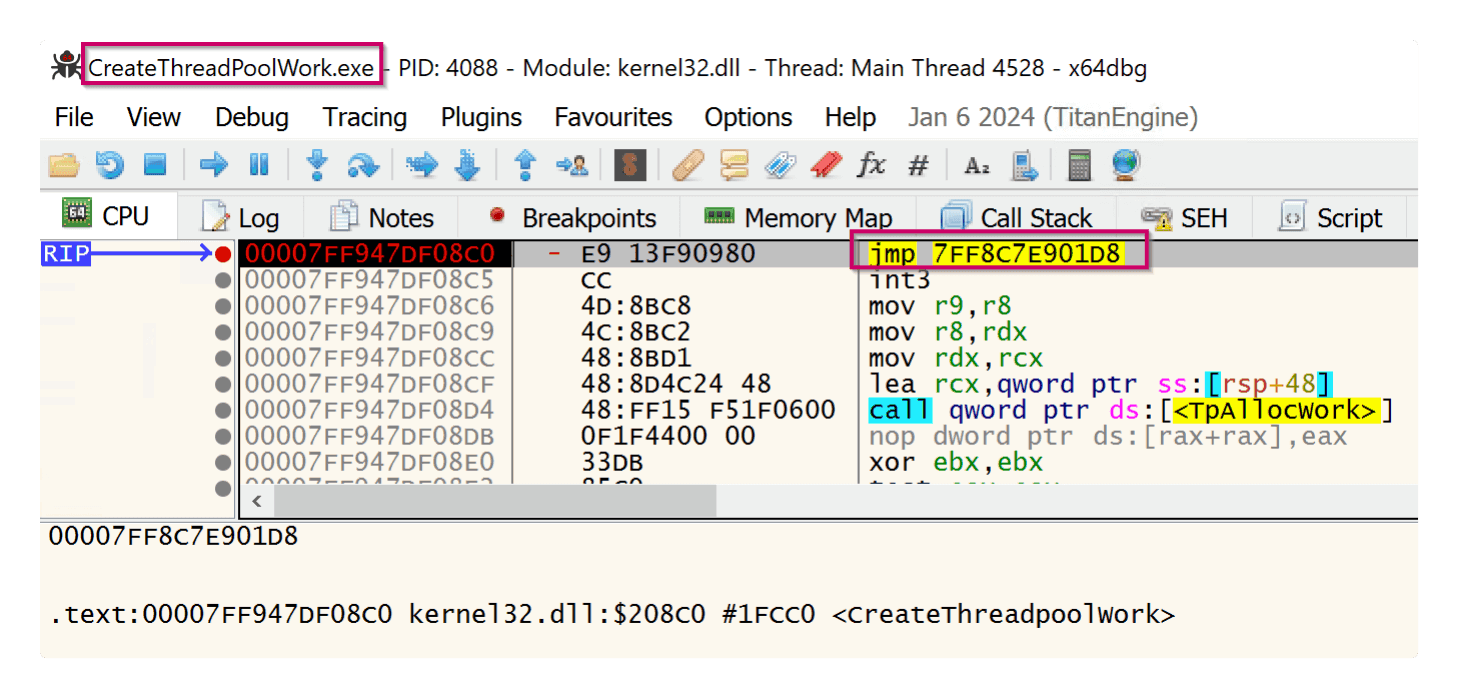
The following figure confirms that we have successfully reached the breakpoint in the context of CreateThreadPoolWork. You can also see that the EDR is setting an inline hook using an unconditional jmp instruction (opcode E9). This means that there is a redirection by the EDR before the native API TpAllocWork is executed in the context.
Before we continue with the program execution and follow the jmp statement in the program flow, we set a breakpoint to the base address of the .text section of the new DLL of the EDR. This allows us to check that we are actually in the memory area of the new DLL after executing the jmp statement in the context of the CreateThreadPoolWork hooked API.

Having completed our preparations, we continue to run our proof-of-concept (POC) shellcode in the debugger. The following figure shows that after using the inline hook, we do not go directly to the memory area of the new DLL. Instead, we stay in the .text area of our POC (.exe). It turns out that there are two more jumps using the jmp instruction before we finally get to the .text area of the new DLL.
The phase where the third jmp instruction is executed is particularly interesting: Here we see the preparation for the jump to the .text region of the new DLL. The instruction mov rax, EDRdll.21B0F9756E0 loads the memory address of function 21B0F9756E0 into the rax register. A subsequent jump (third jump) via unconditional jmp finally takes us to the .text region of the new EDR DLL.

EDR DLL - Internal Logic
In order to substantiate the hypothesis put forward at the beginning, I would like to take a closer look at the program flow in the context of the POC within the new DLL of the EDR by means of a dynamic analysis.
Push Function Arguments to Call Stack
As soon as we have reached the .text region of the new DLL after executing several successive jmp instructions in the program flow, the following figure shows that in a first step the contents of important registers - in particular rcx, rdx, r8 and r9 - are pushed onto the call stack using push instructions. Based on the x64 calling convention, in the context of our POC and the CreateThreadPoolWork function, this means that at this Point of time, the rcx, rdx, r8 and r9 registers contain the function arguments. In short, the function arguments of CreateThreadPoolWork are placed on the call stack at this point.
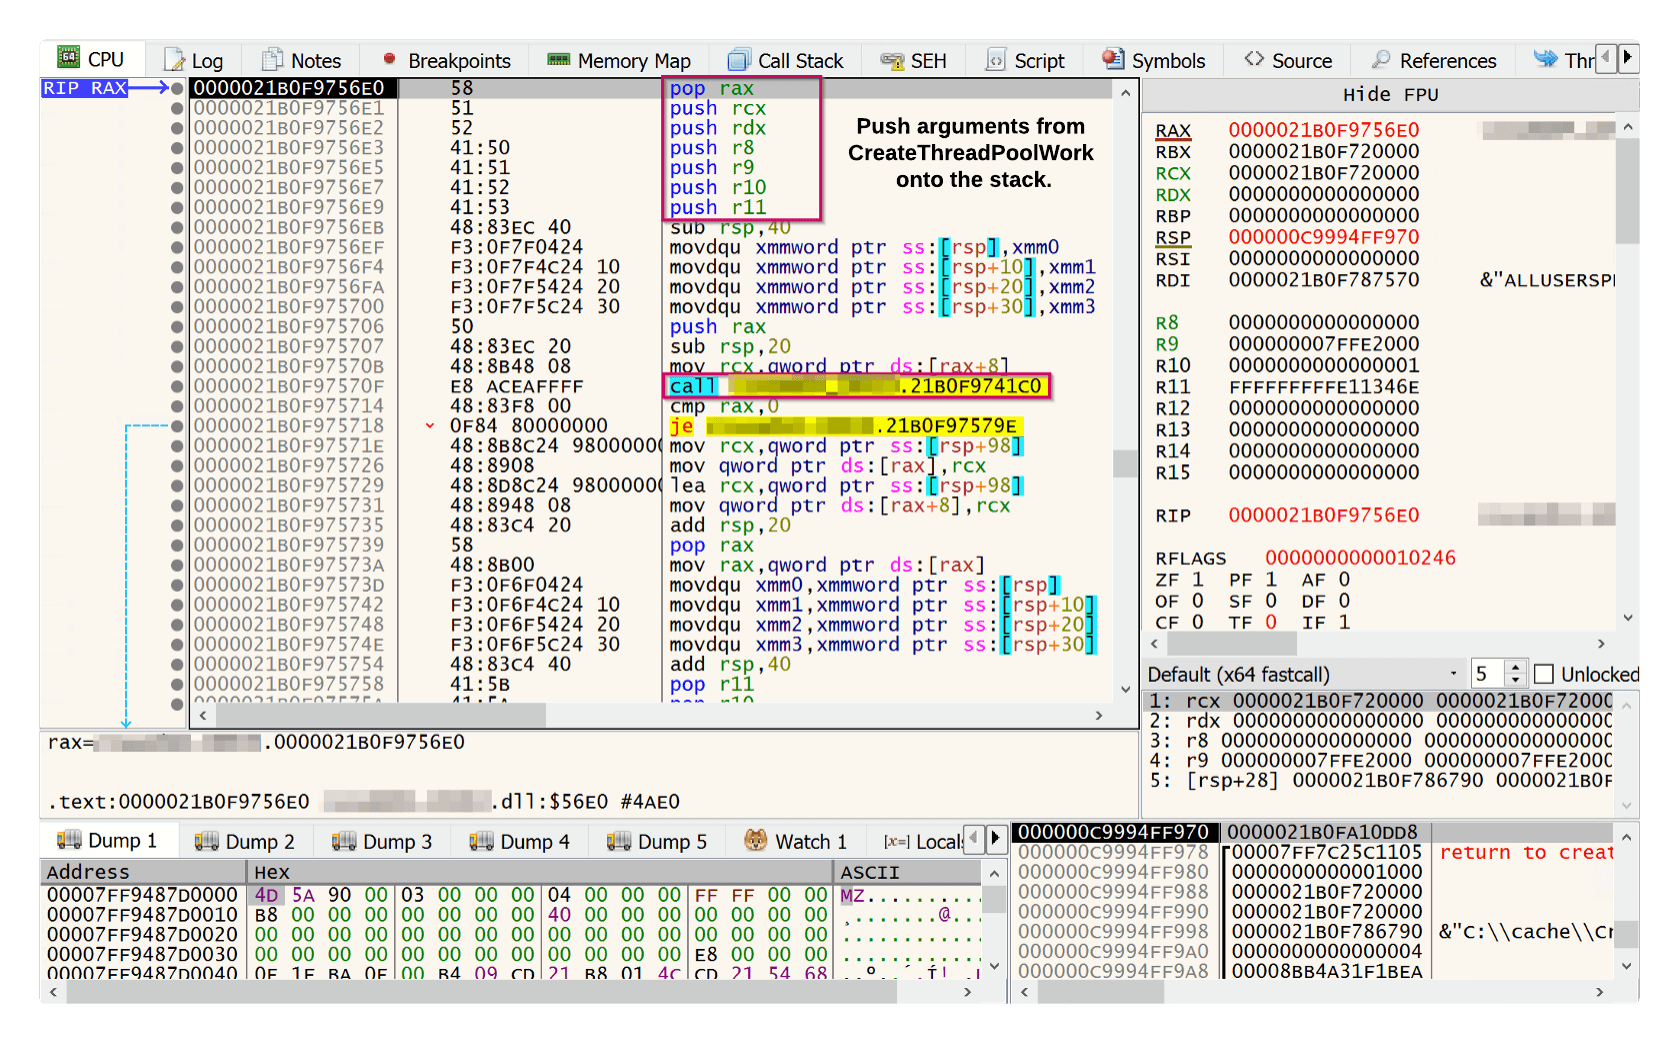
In accordance with the x64 calling convention, the first four arguments of a function are passed directly to the registers in the following order: rcx, rdx, r8, r9. All other function arguments are stored on the stack. However, the following code snippet shows that the CreateThreadPoolWork callback function actually takes only three arguments.
PTP_WORK CreateThreadpoolWork(
  [in]                PTP_WORK_CALLBACK    pfnwk, // rcx
  [in, out, optional] PVOID                pv,    // rdx
  [in, optional]      PTP_CALLBACK_ENVIRON pcbe   // r8
);
Vecored Exception Handling
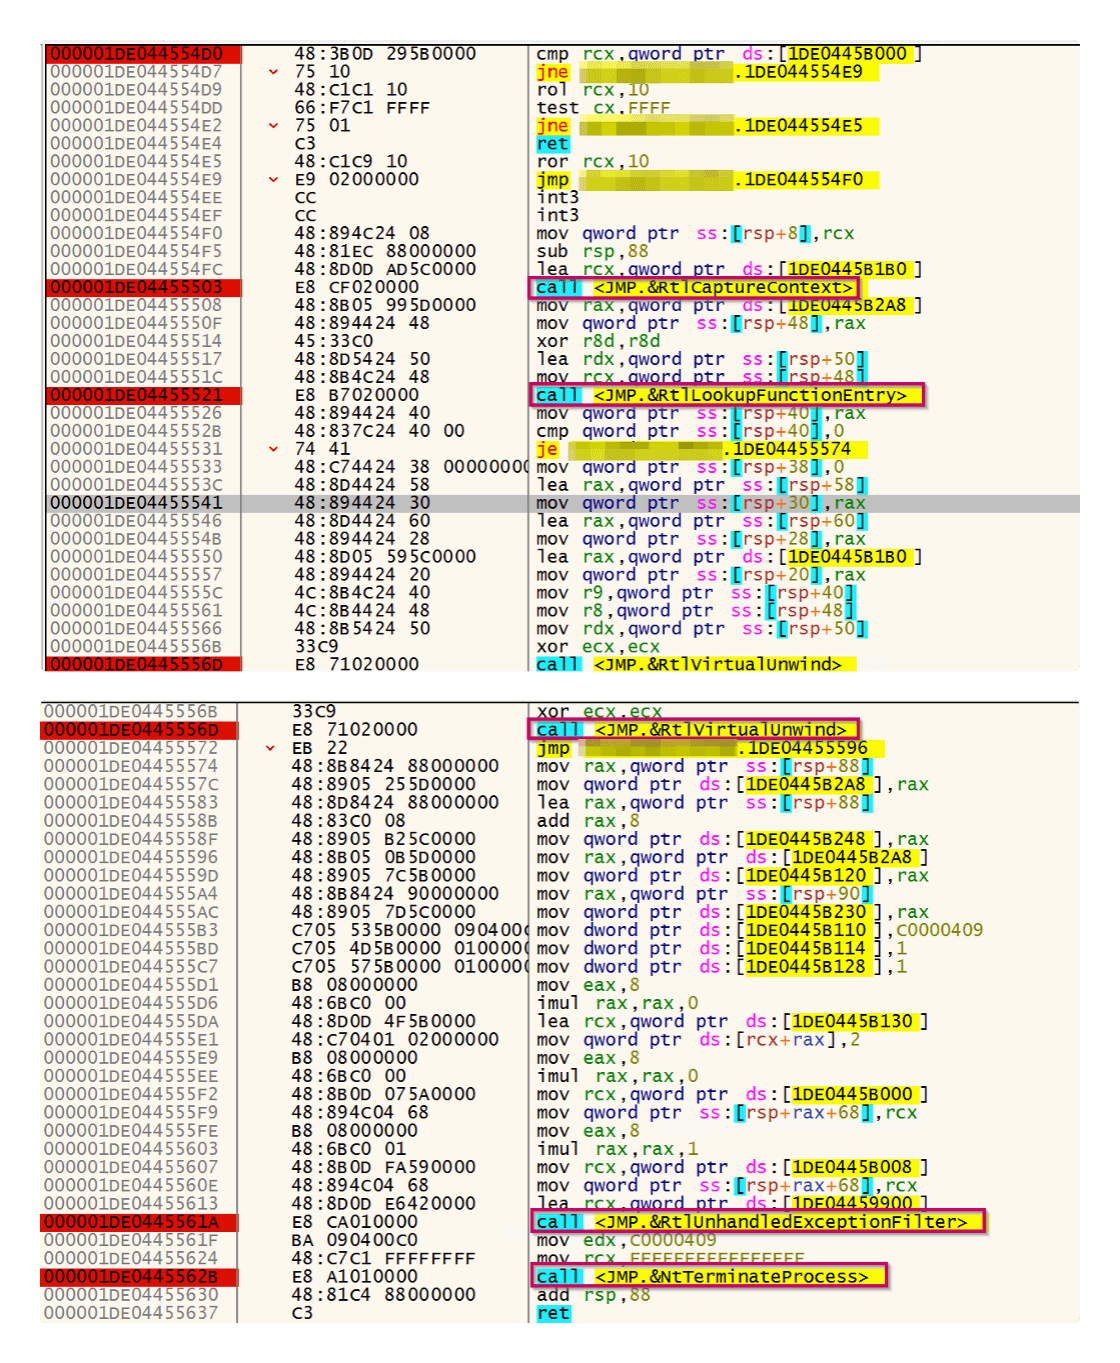
As mentioned above, the EDR registers a Vector Exception Handler (VEH) with the new DLL. Further analysis of the new DLL with x64dbg shows in simplified form that in the event of an exception (e.g. due to access to an unauthorised memory area) the function 1DE044554D0 is called within the new DLL. If we take a closer look at this function, we can see that it is at the heart of the call stack analysis, and should in turn strengthen the hypothesis that was put forward at the beginning.

Function 1DE044554D0 plays a key role in the context of the hypothesis, as analysis of this function reveals the use of several critical APIs that are essential for processing and analysing exception handling scenarios. These include the APIs RtlCaptureContext, RtlLookupFunctionEntry, RtVirtualUnwind, RtlUnhandledExceptionFilter and NtTerminateProcess. In the context of the EDR under investigation, the APIs are used in conjunction with call stack analysis. The following figure provides an overview of the contents of function 1DE044554D0, but the function is described in detail below.
Before I discuss which exception the EDR is likely to be using to trigger its VEH in the next point, and then go into more detail about function 1DE044554D0, let's take a closer look at how we can prove that the EDR is actually using Vectored Exception Handling in the context of the new DLL, or registering a VEH via the new DLL. As explained in my previous article EDR Analysis: Leveraging Fake DLLs, Guard Pages, and VEH for Enhanced Detection, we can check if the process is using VEH by debugging the Process Environment Block (PEB), for example in the context of a process such as notepad.exe on a VM where the EDR under analysis is installed.
This is done by checking the value of CrossProcessFlags in the PEB; if CrossProcessFlags has a decimal value of 4, the process is using VEH according to this documentation by Geoff Chapell. The following figure shows on the left the analysis of CrossProcessFlags within the PEB on a VM with the EDR to be analysed and on the right the analysis of CrossProcessFlags on a VM without EDR installed. It can be seen that CrossProcessFlags on the VM with the EDR to analyse has a decimal value of 4 and therefore VEH is used in the context of notepad.exe and CrossProcessFlags on the VM without EDR has a decimal value of 0 and therefore no VEH is used.

We now know that the use of the VEH is probably due to the EDR, but to further substantiate this theory, or to prove that the registration of the VEH is done by the new EDR DLL, we need to do some debugging. For example, we open the image for notepad.exe within x64dbg, look for the call to the RtlAddVectoredExceptionHandler function within the new EDR DLL and set a breakpoint to the corresponding memory address. With this experiment we want to prove that the registration of the VEH is done by the new EDR DLL. The following figure shows that as soon as the new EDR DLL is loaded into the memory of the running notepad.exe process, the breakpoint that we have set on the RtlAddVectoredExceptionHandler function within the new DLL is triggered. In other words, this proves that the registration of the VEH is being performed by the new EDR DLL.
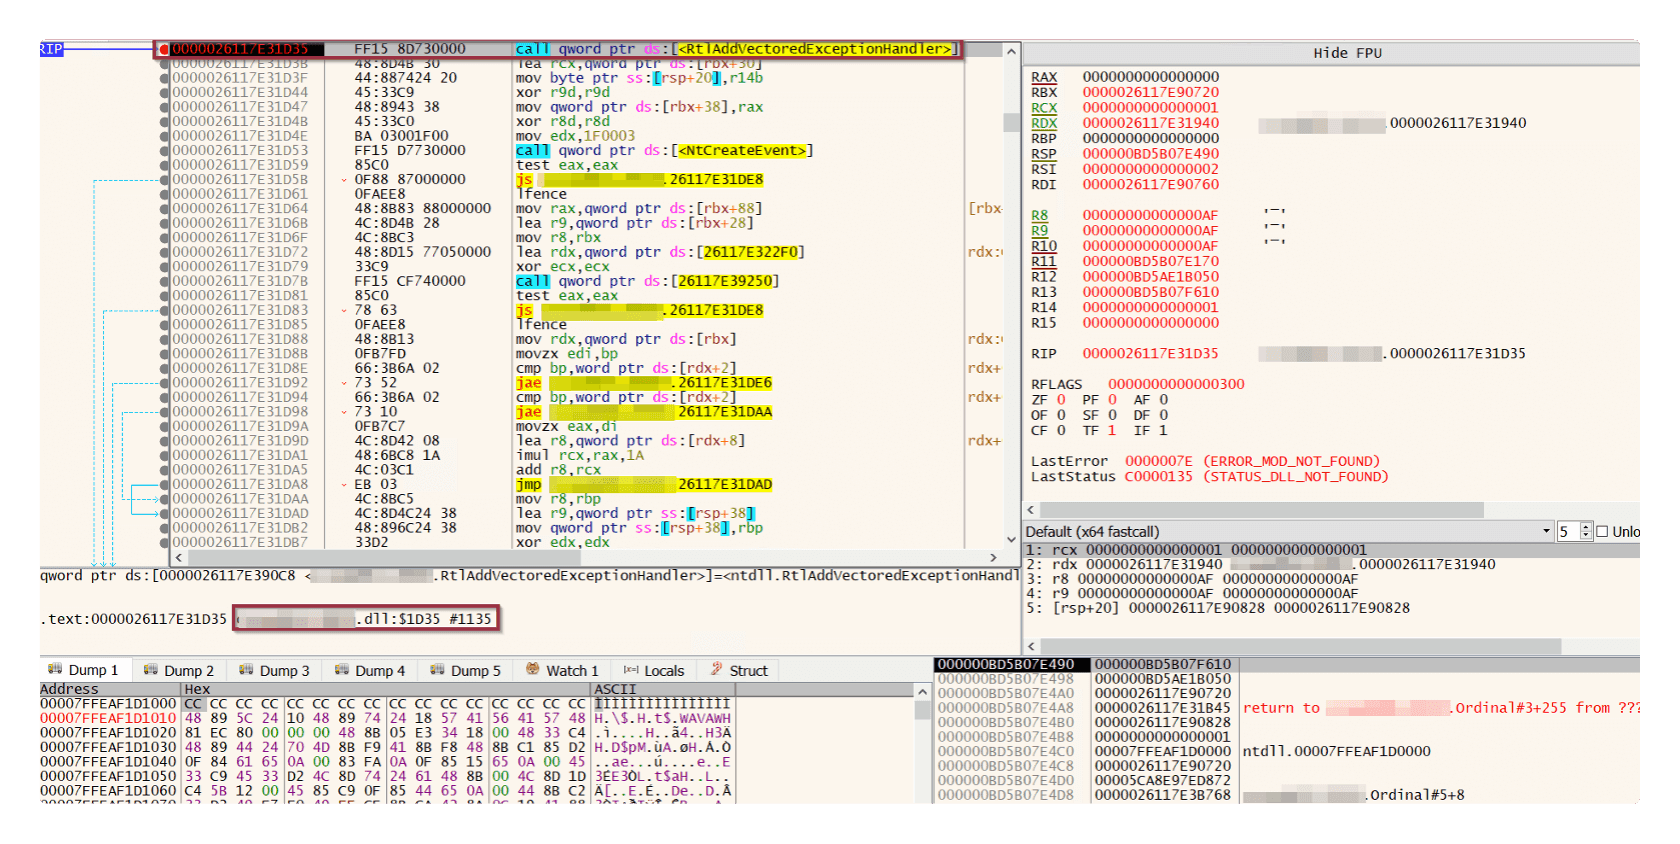
Alternatively, a breakpoint can be set on the native function RtlAddVectoredExceptionHandler within ntdll.dll, and when the breakpoint is reached, it can be checked if and from which memory address the function was called. In the context of notepad.exe, it was possible to prove that notepad.exe uses a VEH by analysing the CrossProcessFlags. Furthermore, debugging with x64dbg proved that the RtlAddVectoredExceptionHandler function was called and the VEH was registered via the new EDR DLL.
Additionally, note that the EDR being analyzed also calls the function RtlAddVectoredExceptionHandler in the context of its user mode hooking DLL, i.e., the EDR registers an additional VEH through the hooking DLL.

Exception - Hardware Breakpoints
This proof was by far the most difficult part of the work and caused me a few sleepless nights. Basically, there are several different types of exceptions that can be defined as ExceptionCode within the EXCEPTION_RECORD structure in a VEH function. For example, this could be a division by zero or an unauthorised memory access. In my previous article EDR Analysis: Leveraging Fake DLLs, Guard Pages, and VEH for Enhanced Detection, you can read for example that the VEH of the affected EDR is triggered by a PAGE_GUARD flag or the corresponding exception STATUS_GUARD_PAGE_VIOLATION (0x80000001), also known as guard page hooking in the game hacking community. In the context of the analysis of this EDR, this does not appear to be the case as the memory areas of the new DLL do not have a PAGE_GUARD flag.

I got a hint that the EDR uses the type EXCEPTION_SINGLE_STEP (hardware breakpoint) as EXCEPTION_RECORD, so I looked into it. I will not go into the details of hardware breakpoints at this point, as it is beyond the scope of this article. If you would like to read more about hardware breakpoints at this point, I recommend the following article Blindside: A New Technique for EDR Avoidance with Hardware Breakpoints.
Nevertheless, a few basics about hardware breakpoints will be helpful in understanding the following explanations. Unlike software breakpoints INT3 at software level, hardware breakpoints (memory breakpoints) are used at processor level within the debug registers. Debug registers are special registers within a CPU that can be used to debug software. Divided into registers DR0-DR3, a maximum of 4 hardware breakpoints can be set in the context of a process. Register DR6 is the status register that provides information on why a breakpoint was triggered and DR7 is the control register that configures how the breakpoints in DR0-DR3 are used. In the context of our EDRs, we assume that hardware breakpoints are set in the context of specific processes at specific memory addresses and that they are triggered by reading, writing or executing at those specific memory addresses.

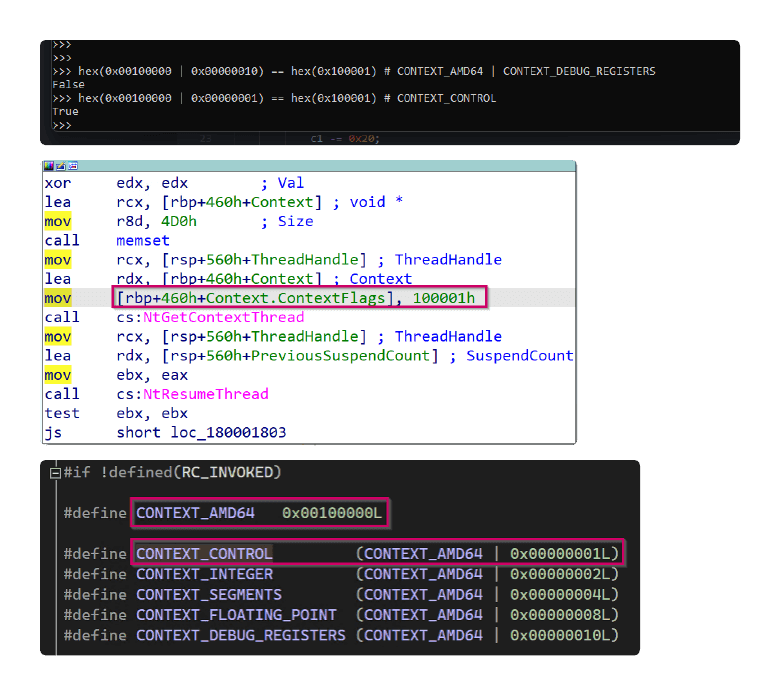
Before I get to the actual explanation, I would like to document a misinterpretation. If you look at the image below, I was able to find the line mov [rbp+460h+Context.ContextFlags], 100001h using static analysis with IDA. My first assumption was that I had identified the part of the code responsible for setting the hardware breakpoint in the debug register, as I initially thought that the value 100001h corresponded to 0x00100000 for CONTEXT_AMD64 and 0x00000010 for CONTEXT_DEBUG_CONTROL. This turned out to be wrong, as the hex value 1000001h corresponds to 0x00100000 for CONTEXT_AMD64 and 0x00100001 for CONTEXT_CONTROL (many thanks to 5pider from Maldev Academy for this explanation).
Some time passed between my initial misinterpretation and the actual proof of the use of hardware breakpoints as an exception. In short, the idea was that the triggering of EDR hardware breakpoints must occur relatively early during the initialisation of a new process or during the loading of modules (DLLs). Based on this assumption, I ran various tests in x64dbg. To cut a long story short, by debugging in the context of the POC and the API LoadLibrayA, I was finally able to find the point in time or the line of code during the loading of a module (DLL) where the hardware breakpoints of the EDR appear in the debug registers and are triggered.

The address in register DR3 could be a hardware breakpoint of the EDR, e.g. triggered by a read or write access (similar in function to the GUARD_PAGE flag (RX+G) in the context of the EDR analysis in my last article). At the moment I am not quite sure why the memory addresses are marked in red and cannot be accessed, but I suspect that it is a virtual address outside the virtual memory of our poc.exe. It could be a virtual address inside the user mode agent of the EDR, but that's just a guess at this point.
It is also worth noting that in the context of our poc.exe, this is just one of several memory addresses that appear to be monitored by EDR through hardware breakpoints. The hardware breakpoints in the debug registers occur on the same line of code in the context of LoadLibraryA of each DLL loaded into memory. It can be assumed that EDR is monitoring other memory addresses for read, write or execution using hardware breakpoints. Although it seems logical, I would like to mention that it can of course be assumed that EDR's hardware breakpoints are also used in the context of other processes and not just in the context of poc.exe.
To be sure that these are indeed hardware breakpoints of the EDR, I ran the same test on a VM without EDR to prove that there are no memory addresses in the debug registers in the same context.

It was also interesting to observe that when I tried to manually overwrite the line nop dword ptr ds:[rax+rax],eax with a hardware breakpoint in x64dbg, the EDR prevented the action by active prevention, exiting the debugger and the POC, and generating a detection. This suggests that the EDR actively monitors its hardware breakpoints and reacts accordingly in the event of manipulation.
Another indicator of the use of hardware breakpoints by the EDR is the fact that the new EDR DLL dynamically imports the NtGetContextThread and NtSetContextThread functions at runtime, i.e. the following figure shows the call of the two functions in the memory of the new EDR DLL.
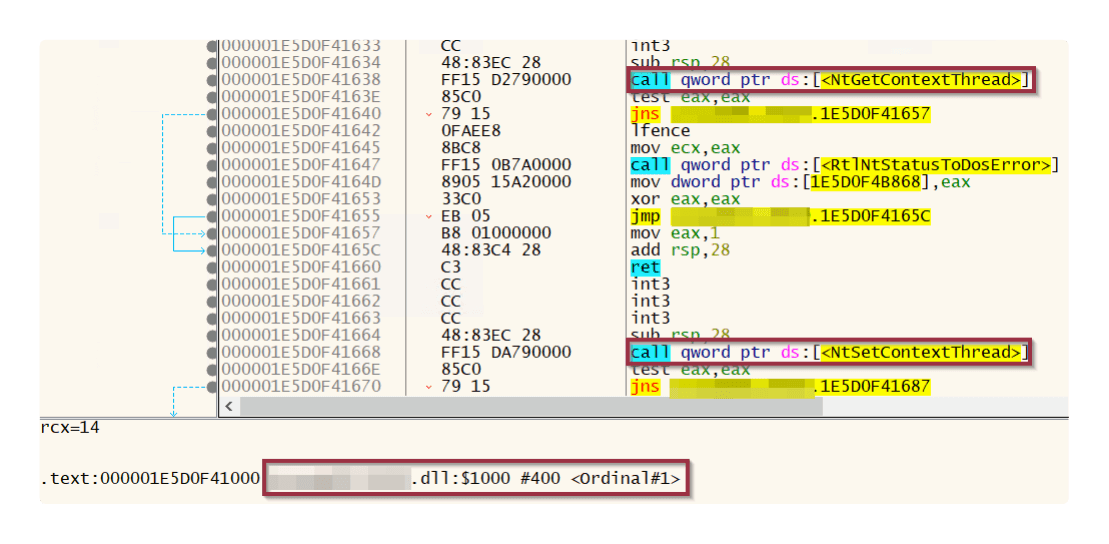
But why does this seem plausible? For example, if you look at the structure of the native functions NtGetContextThread and NtSetContextThread, you can see that the CONTEXT structure is accessed within the functions via the pContext argument. In the context of our analysis of whether the EDR uses hardware breakpoints as exceptions, the CONTEXT structure gives us information about the current use of the debug registers DR0-DR7. This means that the EDR can use NtGetContextThread to check the current state of the debug registers, and possibly also check for malware hardware breakpoint registration, or monitor the EDR's own hardware breakpoints (although this is only a suspicion, which seems plausible based on the previous attempt to overwrite the EDR's HWBPs using HWBP in x64dbg). To register the hardware breakpoints in the debug registers within the CONTEXT structure, the EDR calls the NtSetContextThread function within the new EDR DLL.
Now that we have found out a bit more about the fact that the EDR uses hardware breakpoints as an exception type within the VEH function with a certain probability, we can take a closer look at the aforementioned function 1DE044554D0, which in my opinion is the core of the hypothesis I put forward at the beginning and represents the core of the user mode call stack analysis by the EDR.
RtlCaptureContext
The RtlCaptureContext function within the 1DE044554D0 function is used to capture the context of the current thread and access important information such as processor specific registers, counters and stack pointers. The captured context is stored in a context structure and provides a snapshot of the thread state at the time of the exception. This snapshot is crucial for diagnosing problems and understanding the sequence of events that led to the exception. Recall that in the context of our CreateThreaPoolWork POC, the rcx, rdx, r8 and r9 registers contain the function arguments of CreateThreaPoolWork.
Once the thread context has been captured, the return address stored in the CONTEXT structure is passed to another important function, RtlLookupFunctionEntry.
RtlLookupFunctionEntry
The API RtlLookupFunctionEntry retrieves a pointer to a RUNTIME_FUNCTION structure containing the stack unwind data. The unwind data is essential for navigating back through the call stack, a process known as stack unwinding. This allows the EDR to trace the sequence of function calls that led to the exception.

RtlVirtualUnwind
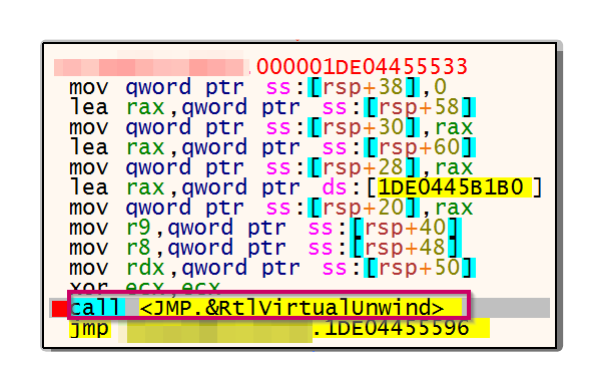
As part of the call stack analysis by the new DLL, the RtlVirtualUnwind function is used to simulate the unwinding of the stack, which determines the context of the caller for each stack frame. This approach is crucial for reconstructing the call sequence that led to an exception.
A critical aspect of this analysis is the identification of unbacked memory regions during the unwinding process. Unbacked memory regions are special memory areas that are occupied by executed code but cannot be assigned to a physical module - for example, there is no direct assignment to known modules such as kernel32.dll. This indicates that the executed code may come from a source that is not represented by a file present on the hard disk, and points to potential security risks such as malicious code execution.
By comparing the unwind data with the results of the API RtlVirtualUnwind, the authenticity and legitimacy of the call stack can be effectively verified.
NtTerminateProcess
If, after a detailed analysis of the call stack triggered by a particular exception, certain criteria are met, the Endpoint Detection and Response (EDR) mechanism makes a decision within the specific function 1DE044554D0 as to whether the process in question - in this context our poc.exe - should be terminated using the API NtTerminateProcess. A possible example of such a criterion could be the identification of stack frames indicating unbacked memory areas or suggesting direct or indirect syscalls.

In the event of an unexpected exception, there is no handling by the EDR's VEH, but a transfer or jump to the address of the function RtlUnhandledExceptionFilter within ntdll.dll. This is a sort of last-resort mechanism under Windows for handling an unhandled exception.
Summary
In the introduction to this blog post it was hypothesised that the EDR under investigation used a new DLL that was used in conjunction with certain Windows APIs to identify malware using telemetry obtained from thread call stack analysis.
Using the tool System Informer, it was determined that the EDR under investigation used another new DLL in addition to the already known inline hooking DLL. Debugging with x64dbg revealed that this new DLL is used to hook other APIs such as CreateThreadPoolWork, CreateThreadPoolWait, OpenProcess, WriteProcessMemory etc. in addition to the already known hooking APIs such as NtAllocateVirtualMemory. Depending on how the EDR is configured, the total number of inline hooks is more than 150.
A simple static analysis of the new DLL with IDA supports this hypothesis somewhat, as APIs such as RtlAddVectoredExceptionHandler, RtlCaptureContext, RtlLookupFunctionEntry, RtVirtualUnwind, RtlUnhandledExceptionFilter and NtTerminateProcess are used within function 1DE044554D0, which are used in the context of x64 exception handling and call stack analysis.
By debugging in the context of the POC used and the CreateThreadPoolWork API, we were able to determine that we could access the .text region of the new DLL of the EDR using several jmp instructions. The current contents of the rcx, rdx, r8 and r9 registers are then pushed onto the call stack using a push instruction. At this point, based on the x64 calling convention, these registers contain the function arguments of the CreateThreadPoolWork function, or more precisely, only the rcx, rdx and r8 registers, as CreateThreadPoolWork has only three function arguments.
For example, in the context of our POC, if an exception is thrown by the hardware breakpoints registered by the EDR in the debug registers, the EDR's VEH will be triggered. Further dynamic analysis of the new DLL revealed that the vectored exception handler calls function 1DE044554D0. This function ultimately contains the logic or APIs necessary to analyse and decide whether the thread call stack appears legitimate or not and, if necessary, terminate the thread or process.
Interpretation
Analysis of the new Endpoint Detection and Response (EDR) system DLL suggests that it is being used for call stack analysis in the context of the affected APIs, such as CreateThreadPoolWork. This is undoubtedly an interesting approach, and one that I believe is being used by attackers, albeit with the aim of performing thread call stack spoofing.
The approach seems plausible as it can potentially be used to identify unbacked memory regions, direct syscalls and indirect syscalls. However, the question arises as to whether this form of call stack analysis is not significantly more susceptible to manipulation than other methods, such as implementation via Event Tracing for Windows Threat Intelligence (EtwTi). For example, the call stack analysis of the affected EDR could be bypassed relatively easily by unhooking the .text region containing the affected (hooked) APIs, e.g. CreateThreadPoolWork in kernel32.dll, and overwriting it with an unhooked version of the .text region of kernel32.dll.
In the context of hardware breakpoints, another conceivable option would be to specifically overwrite the hardware breakpoints in the debug registers DR0-DR3, thus preventing the exception from being thrown in order to initialise the call stack analysis process by the EDR. However, it has been shown that the EDR monitors and protects its registered hardware breakpoints. In other words, a way would have to be found to manipulate or overwrite the hardware breakpoints without the EDR noticing. But that's just conjecture, and exploring this topic alone would probably be worth a separate article.
I hope this article has given you a little insight into the inner workings of EDR in conjunction with the new DLL and the use of call stack analysis via user mode code, and thank you for reading. Until the next article.
Happy Hacking!
Daniel Feichter @VirtualAllocEx
References
- https://www.elastic.co/securit...
- https://learn.microsoft.com/en...
- https://learn.microsoft.com/en...
- https://learn.microsoft.com/en...
- https://medium.com/@fsx30/vect...
- https://mark.rxmsolutions.com/...
- https://research.nccgroup.com/...
- https://dimitrifourny.github.i...
- https://github.com/mgeeky/Thre...
- https://klezvirus.github.io/Re...
- https://labs.withsecure.com/pu...
- https://www.codereversing.com/...